The Fiscal Year 2026 Mayor’s Management Report, released on September 18, delivers the first data-driven assessment of city agency performance under Mayor Zohran Mamdani — and the results are a split decision. Major felony crime fell more than 2% to 118,866 incidents, pothole repairs surged 27%, and organic waste diversion reached a record 205,100 tons. But ambulance response times to life-threatening emergencies climbed 20%, NYPD response times to crimes in progress slowed by roughly 26 seconds, and the report’s sharpest critics noted that the fiscal year it covers — July 1, 2025, through June 30, 2026 — straddles two administrations, making it difficult to assign credit or blame for any single metric.
Key Takeaways
- The FY 2026 Mayor’s Management Report covers July 2025 through June 2026, spanning the final six months of the Adams administration and the first six months under Mayor Mamdani.
- Major felony crime fell more than 2%, dropping to 118,866 incidents citywide.
- Ambulance and fire company dispatch-to-arrival times for life-threatening emergencies rose by 1 minute and 28 seconds, reaching 9 minutes and 13 seconds — a 20% increase for ambulances specifically.
- NYPD response times to all crimes in progress grew by about 26 seconds, rising to 12 minutes and 30 seconds; critical crime response times increased 6% to 7 minutes and 15 seconds.
- Pothole repairs climbed 27% to 229,000; speed bump installations rose 25%; pavement safety markings increased 22%.
- Organic waste diversion reached a record 205,100 tons under the nation’s largest mandatory curbside composting program, a 25% increase.
Two Administrations, One Report Card
The annual Mayor’s Management Report is the city’s most comprehensive public accounting of how its agencies are performing. It tracks hundreds of indicators across every major department, from the NYPD and FDNY to the Department of Sanitation and the Parks Department. The FY 2026 edition carries Mayor Mamdani’s name on the cover, but its data window opens well before the current administration took office on January 1, 2026. The first half of the reporting period captures the final months under former Mayor Eric Adams, who left office amid federal criminal charges. The second half captures the early policy and operational decisions of the Mamdani administration.
That split timeline matters for every number in the report. A decline in crime that began under one mayor may have continued under the next, or it may have accelerated. A rise in response times may reflect staffing decisions made months before the transition, or it may signal a change in operational priorities. City & State New York noted this structural limitation directly, writing that the report is not a complete picture of how the city has operated since the 34-year-old democratic socialist mayor took the reins — it is, at most, a shared portrait. The Mamdani administration’s full performance will not be visible until the FY 2027 report, which will cover the first complete fiscal year under the current mayor.
Crime Numbers Move in the Administration’s Favor
The headline crime figure — a decline of more than 2% in major felony incidents, bringing the total to 118,866 — gives the Mamdani administration a favorable data point heading into its first full year. The Mayor’s Management Report attributed the improvement to continued investment in accountability and safety across public spaces, housing developments, and public transportation. The report did not break the crime data into pre-Mamdani and post-Mamdani segments, so the extent to which the decline reflects policies initiated before January 2026 remains an open question.
The improvement in the felony count, however, exists alongside a less encouraging picture in enforcement capacity. NYPD end-to-end response times to all crimes in progress increased by approximately 26 seconds, rising to 12 minutes and 30 seconds. For critical crimes in progress — the most urgent category — response times grew 6%, reaching 7 minutes and 15 seconds. The response time trend has persisted across multiple fiscal years and predates the Mamdani administration, but the continued deterioration complicates the narrative of a safer city. A city that is experiencing less crime but responding more slowly when crime does occur presents a difficult tradeoff for residents to evaluate.
Ambulance Response Times Record the Steepest Decline
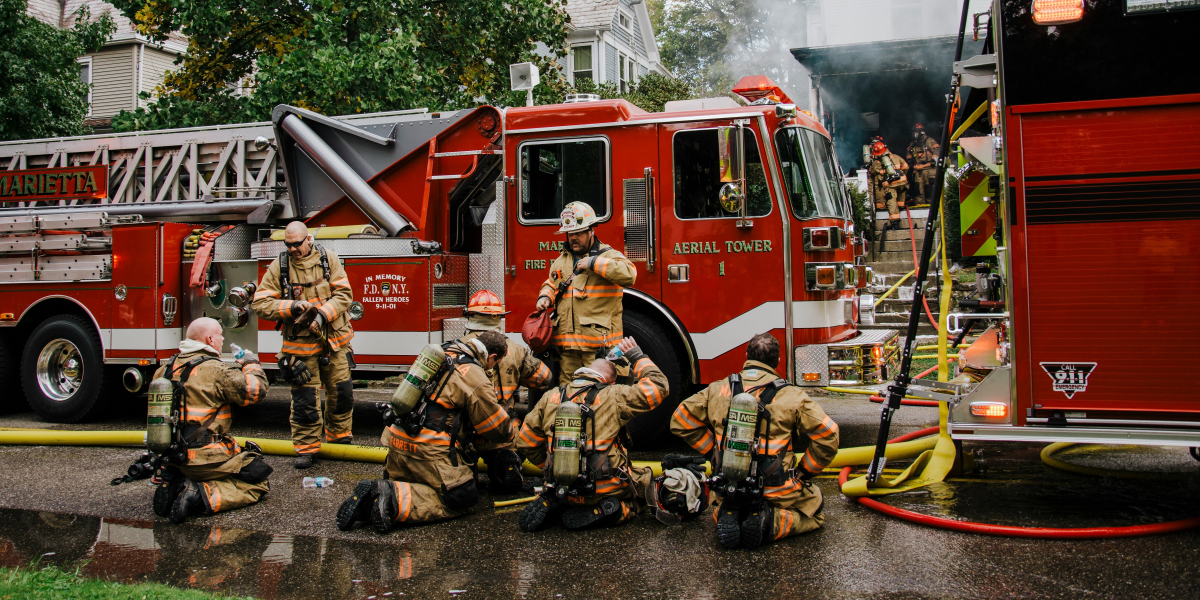
The most concerning data point in the entire report sits in the FDNY section. Dispatch-and-travel time for ambulances and fire companies responding to life-threatening medical emergencies rose by 1 minute and 28 seconds compared to the prior fiscal year, climbing to 9 minutes and 13 seconds. Ambulances alone saw a 20% increase in response time — a metric that directly affects patient outcomes in cardiac events, strokes, and severe trauma cases where every minute of delay reduces the probability of survival.
The FDNY has responded to the trend by adding Paramedic Response Units, which are designed to treat more patients per unit and reduce the burden on traditional ambulance crews. The department has also expanded its rapid response protocols. But the scale of the increase — nearly a minute and a half across the board — suggests a systemic capacity issue rather than one that can be resolved with targeted operational adjustments. Staffing, deployment patterns, hospital turnaround times, and the geographic distribution of emergency calls all contribute to the response time equation, and none of those variables have a quick fix.
The response time data has drawn attention from the City Council, which is expected to press the administration on FDNY performance metrics during upcoming budget hearings. For a city that experienced 210 traffic fatalities in 2025 and continues to face elevated volumes of 911 calls, the gap between emergency need and emergency capacity is not an abstract concern.
Infrastructure and Service Delivery Show Measurable Gains
Where the report struggles on response times, it delivers more favorable numbers on physical infrastructure and street-level service delivery. Pothole repairs rose 27% to 229,000, a figure the Mamdani administration has highlighted as a signature achievement of its “pothole blitz” program — a rapid-response model where residents report potholes through 311 and social media, and city crews prioritize quick turnaround. The format gained viral traction earlier in the year when a New York City resident posted a video of two potholes and found them paved within hours.
Speed bump installations increased 25%, and pavement safety markings — crosswalk restriping, lane indicators, and turn arrows — grew 22%. Porous pavement installations, which help manage stormwater runoff and reduce localized flooding, jumped 44% to 96,853 square feet. These infrastructure metrics align with the administration’s broader investment in flood resilience and street safety, including the Vision Zero Reimagined plan released three days before the management report.
Organic waste diversion reached a record 205,100 tons, a 25% increase over the prior year, driven by the continued expansion of the city’s mandatory curbside composting program — now the largest such program in the United States. The composting program, which requires residents in all five boroughs to separate food scraps, food-soiled paper, and yard waste from regular trash, has been one of the clearest operational successes across multiple administrations. The diversion tonnage represents material that would otherwise be trucked to landfills, where it decomposes and produces methane. The milestone reflects a broader shift in how New York City manages waste, part of the city’s expanding portfolio of sustainability and green infrastructure initiatives that have reshaped everything from rooftop design to curbside operations over the past decade.
Parks, Recreation, and Quality-of-Life Indicators Point Upward
Parks and recreation data in the report showed growth across several categories. Recreation center membership rose 13% to nearly 180,000, indicating that more New Yorkers are using city-operated gyms, pools, and community facilities. The increase tracks with a post-pandemic recovery pattern but also reflects investments in facility maintenance and programming that the Parks Department has expanded under both the Adams and Mamdani administrations.
Tree planting, playground resurfacing, and public space activations — including the Mamdani administration’s “Renew Crew,” a 24-person team of painters, electricians, plumbers, and trade specialists deployed to park maintenance — all received favorable mentions in the report. The administration is positioning these quality-of-life metrics as evidence of a governing philosophy it calls “pothole politics,” a framework built on the premise that trust in government is rebuilt through visible, tangible improvements in the physical environment that residents encounter every day.
What the FY 2027 Report Will Need to Show
The FY 2026 Mayor’s Management Report is, by the Mamdani administration’s own framing, a starting point rather than a verdict. The mixed-administration reporting window limits how much any single number can be attributed to current policy decisions. The true test will arrive in September 2027, when the FY 2027 report delivers a full 12 months of data covering the period from July 2026 through June 2027 — the first fiscal year entirely under Mamdani’s governance.
The metrics that will define that future report are already in motion. Whether ambulance response times stabilize or continue to worsen will depend on hiring and deployment decisions being made now. Whether the pothole blitz model sustains its momentum through a second winter cycle will test the administration’s operational consistency. And whether the crime decline holds without corresponding improvements in police response capacity will determine how New Yorkers assess the gap between the city’s statistical safety and their lived experience on the street.
“Every number in this report represents a New Yorker we have a responsibility to serve,” Mayor Mamdani said in a statement accompanying the report’s release. “Our job is to serve them better and better every day.” The next 12 months of data will determine whether that trajectory holds.
FAQs
What Period Does the FY 2026 Mayor’s Management Report Cover?
The FY 2026 Mayor’s Management Report covers July 1, 2025, through June 30, 2026. This period includes the final six months of the Adams administration and the first six months under Mayor Zohran Mamdani, making it a shared report card across two administrations.
How Much Did Ambulance Response Times Increase in the Report?
Dispatch-and-travel time for ambulances and fire companies responding to life-threatening medical emergencies rose by 1 minute and 28 seconds compared to the prior fiscal year, reaching 9 minutes and 13 seconds. Ambulances alone experienced a 20% increase in response time.
What Were the Positive Infrastructure Results in the Report?
Pothole repairs rose 27% to 229,000, speed bump installations increased 25%, pavement safety markings grew 22%, and porous pavement installations jumped 44%. Organic waste diversion reached a record 205,100 tons, a 25% increase, under the nation’s largest mandatory curbside composting program.
Did Crime Go Up or Down in New York City According to the Report?
Major felony crime fell more than 2% to 118,866 incidents. However, NYPD response times to crimes in progress increased by approximately 26 seconds to 12 minutes and 30 seconds, and response times to critical crimes rose 6% to 7 minutes and 15 seconds.